 - TaskIT")
There's a lot new in Smartsheet! Read on to find out more about some of the exciting features we've started offering in the last quarter, including the new whiteboard view, a wider dashboard screen, more AI features and advanced Resource Management reports.
Frame view: a new way to visualize your work
We're excited to launch the new Smartsheet board view, designed to change the way you view work, increase flexibility and maximize productivity using the Agile methodology.
The tasks in the board view are shown as cards on a Kanban board. To prioritize and reorganize tasks, simply drag and drop the cards. With the ability to create a hierarchy of tasks by generating child cards directly on the board view, single-stripe scrolling to easily locate a specific card and the improved viewing and editing of card details, you can do a lot without switching views.
What's more, the frame view features continuous autosave and real-time collaboration, so you never lose edits or duplicate work that someone else on the team has already done.
If you work in agile work management processes or simply want a clearer way of visualizing tasks, the board view has everything you need. It's available to users of all Smartsheet plans.
Wider panel display: see more, scroll less
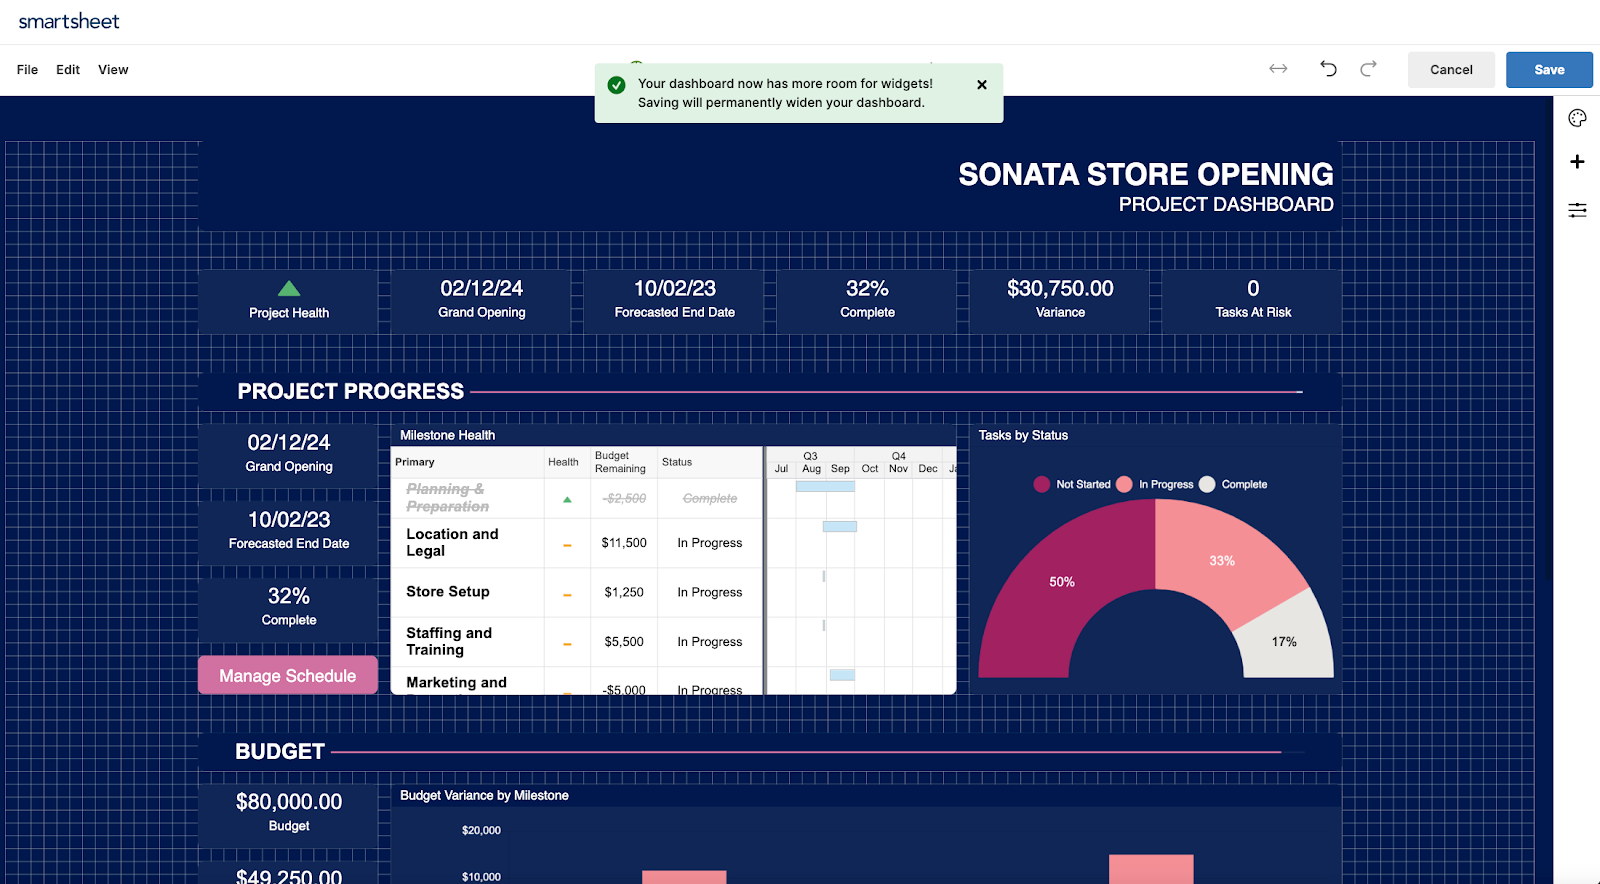
We know it can be challenging to get all the details of a project onto a single screen, and sometimes you have to scroll a lot to see everything on the panels. That's why we offer the option of enlarging any standard-sized panel screen. Wider dashboard screens give you more space to view work on widescreen displays so you can present more content above the scroll line, making dashboard layouts more effective than ever.
When editing a panel, click on the expand icon and take advantage of the extra space to work. It's like expanding the desktop to get a clearer view of everything you're managing.
We've also added dashboard zoom control for large screens to ensure that the content is readable, regardless of screen size. Have fun creating dashboards!
Data analysis: AI data insights at your fingertips
Exploring data to produce graphs and metrics that offer actionable insights can seem like a challenging task, but it doesn't have to be. With Data Analytics, Smartsheet's newest AI feature, you can ask questions of your data, get immediate answers and improve results. This helps you cut down on time spent in follow-up meetings, as well as identifying meaningful metrics and creating graphs in real time.
To take advantage of this new advanced tool, simply access any spreadsheet, click on the "Generate with AI tools" icon and select "Data analysis". You can enter a personalized prompt in the box using informal language or ask the tool to suggest a question to start gathering insights at the click of a button. From status breakdowns to data aggregations, and from simple calculations to specific bar charts, the Data Analysis feature quickly provides the analysis you need to move your work forward.
When you use the data analysis feature to generate a graph or metric, you can expand the "Explain result" section and access a step-by-step explanation of how the tool generated the answer. This way, you can trust the data analysis.
The AI data analysis feature is available to Enterprise plan users.
Advanced Resource Management reports: effortless integration, improved visibility
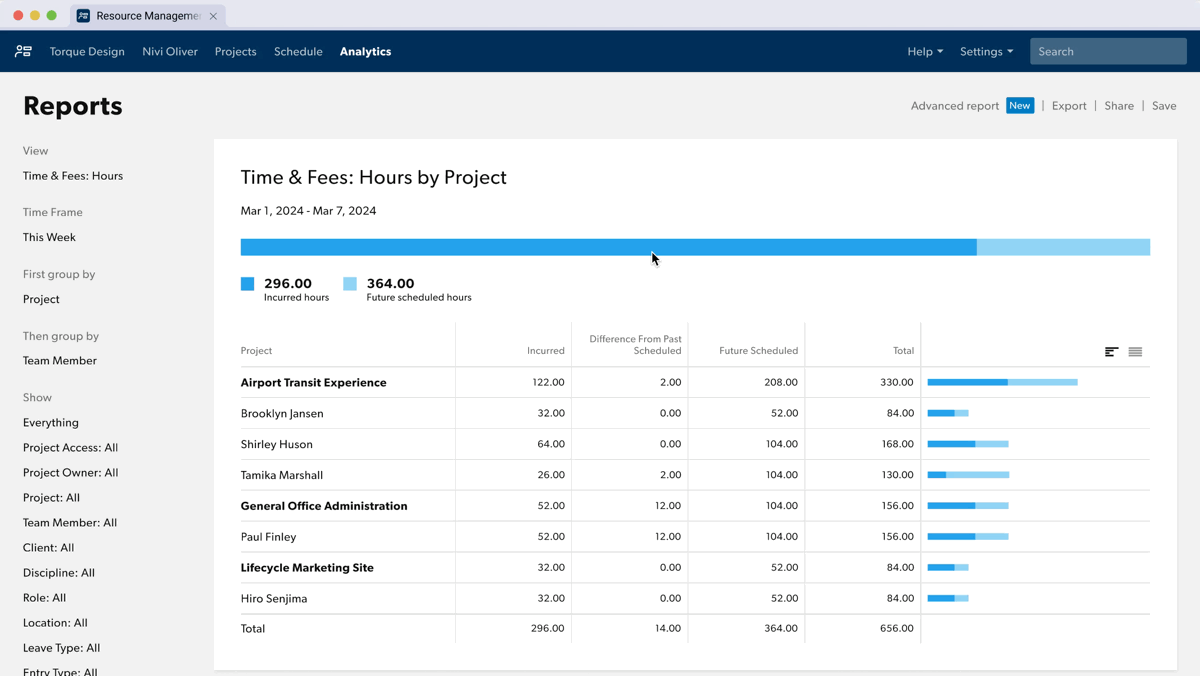
If you have Resource Management by Smartsheet, you can now use our new advanced reporting feature to transfer your report data directly to Smartsheet. You can perform detailed analyses and create visualizations in the spreadsheet to make informed decisions about your organization's resources.
Using advanced reports generates a new spreadsheet in the Smartsheet folder or workspace of your choice, containing the underlying Resource Management dataset. This data is updated automatically each day or can be updated manually on demand, so you always have access to the most up-to-date data directly in Smartsheet.
Resource Management's advanced reporting feature also creates a Smartsheet report that you can customize by adding columns, groupings, classifications and much more to create a visualization of the data that is most meaningful to you.
The integration of Resource Management reports with Smartsheet also allows you to merge Resource Management data with other Smartsheet data, create dashboards and WorkApps and take advantage of Smartsheet's automation features, improving visibility and decision-making.
Next quarter, we'll be bringing you more innovative Smartsheet features and enhancements.

Was this article useful? Want to use Smartsheet now? We can help you!
Change the value of a cell in Smartsheet, learn now!
May
Smartsheet vs Excel: What are the differences?
May
Free Users in Smartsheet: Permissions and limitations
Aug
Smartsheet tips: Commentator
Jun
Manage personal profile in Smartsheet
Aug
How to import data from Smartsheet to Excel quickly and easily
May
Smartsheet dashboards, how does it work?
May
Working with Smartsheet results in quality of life in everyday work
Feb